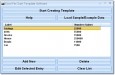
Excel Pivot Charts
Advertisement
ADVIZOR Analyst/X Office v.5.8.1.39654
With Analyst Office™ business managers and analysts can easily load data, do analysis, and share results within minutes - and all they need is a mouse!
Advertisement
STATISTICA v.10.0.1011
Statistica is a robust and user-friendly program designed to meet most of the statistics needs.
SSIS+ v.1 2
Library of SSIS tasks, components and scripts for handling Zip, GZip, BZip2, Tar archives, enhanced script reuse and secure internet communications. This is the current list of components: Secure FTP Task - Securely send, receive, delete, or rename
Filecats Explore v.2.2
With just two clicks, Filecats Explore catalogs the Windows Explorer columns into a table. Sort, filter, copy and analyse. Open files from the table. It is easy to use, yet powerful. Try it for yourself for free. For more, try Filecats Metadata.

Excel Copy and Paste Multiple Charts Into MS Word Software
Copy multiple charts from MS Excel into a new or existing MS Word document. Excel 2000 or higher required. Word 2000 or higher required.

Excel Extract Data From Charts or Graph Software
Extract data from one or many charts in MS Excel. Save all extraction results as a text file. Excel 2000 or higher required.
Pivot Table v.2
NeoNeuro Pivot Table. Free. Automatic Pivot Table shows trends and charts, reveals leaders and outsiders in all parameters like region, product or in any others in one click! Save you time, use the best - download free NeoNeuro Pivot Table now!
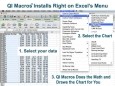
QI Macros SPC Software for Excel v.2016-08
Affordable, easy to use SPC add-in for Excel draws pareto charts, control charts, histograms, box and whisker plots, scatter plots and more. Just select your data and then select a chart from QI Macros menu. Automated fishbone, statistical tests too.
Dashboard Tools for Excel v.2.2.0
With Dashboard Tools for Excel you can use Sparklines, Heatmaps, Mini Charts, Bump charts and other special charts, getting dramatically improved data visualization for fast and effective parallel comparisons.
Excel Pie Chart Template Software v.7.0
This software offers a solution to users who want to create a simple pie chart. Excel fields are automatically generated and editable. By quickly generating pie charts, you will be able to visually represent data easily. Excel 2000 or higher required
PlusX Excel Add-In v.1.2
PlusX Excel Add-In Create Waterfall ( Bridge ) , Gantt ( Project ) , QIGS , Mirror , BubbleX and Double Donut Charts. Follow up Live FX Currency Rates. Use the Excel-internal Web Browser. Benefit of various Shortcuts Free , safe , easy install